-
Building native Gantt Charts in Power BI

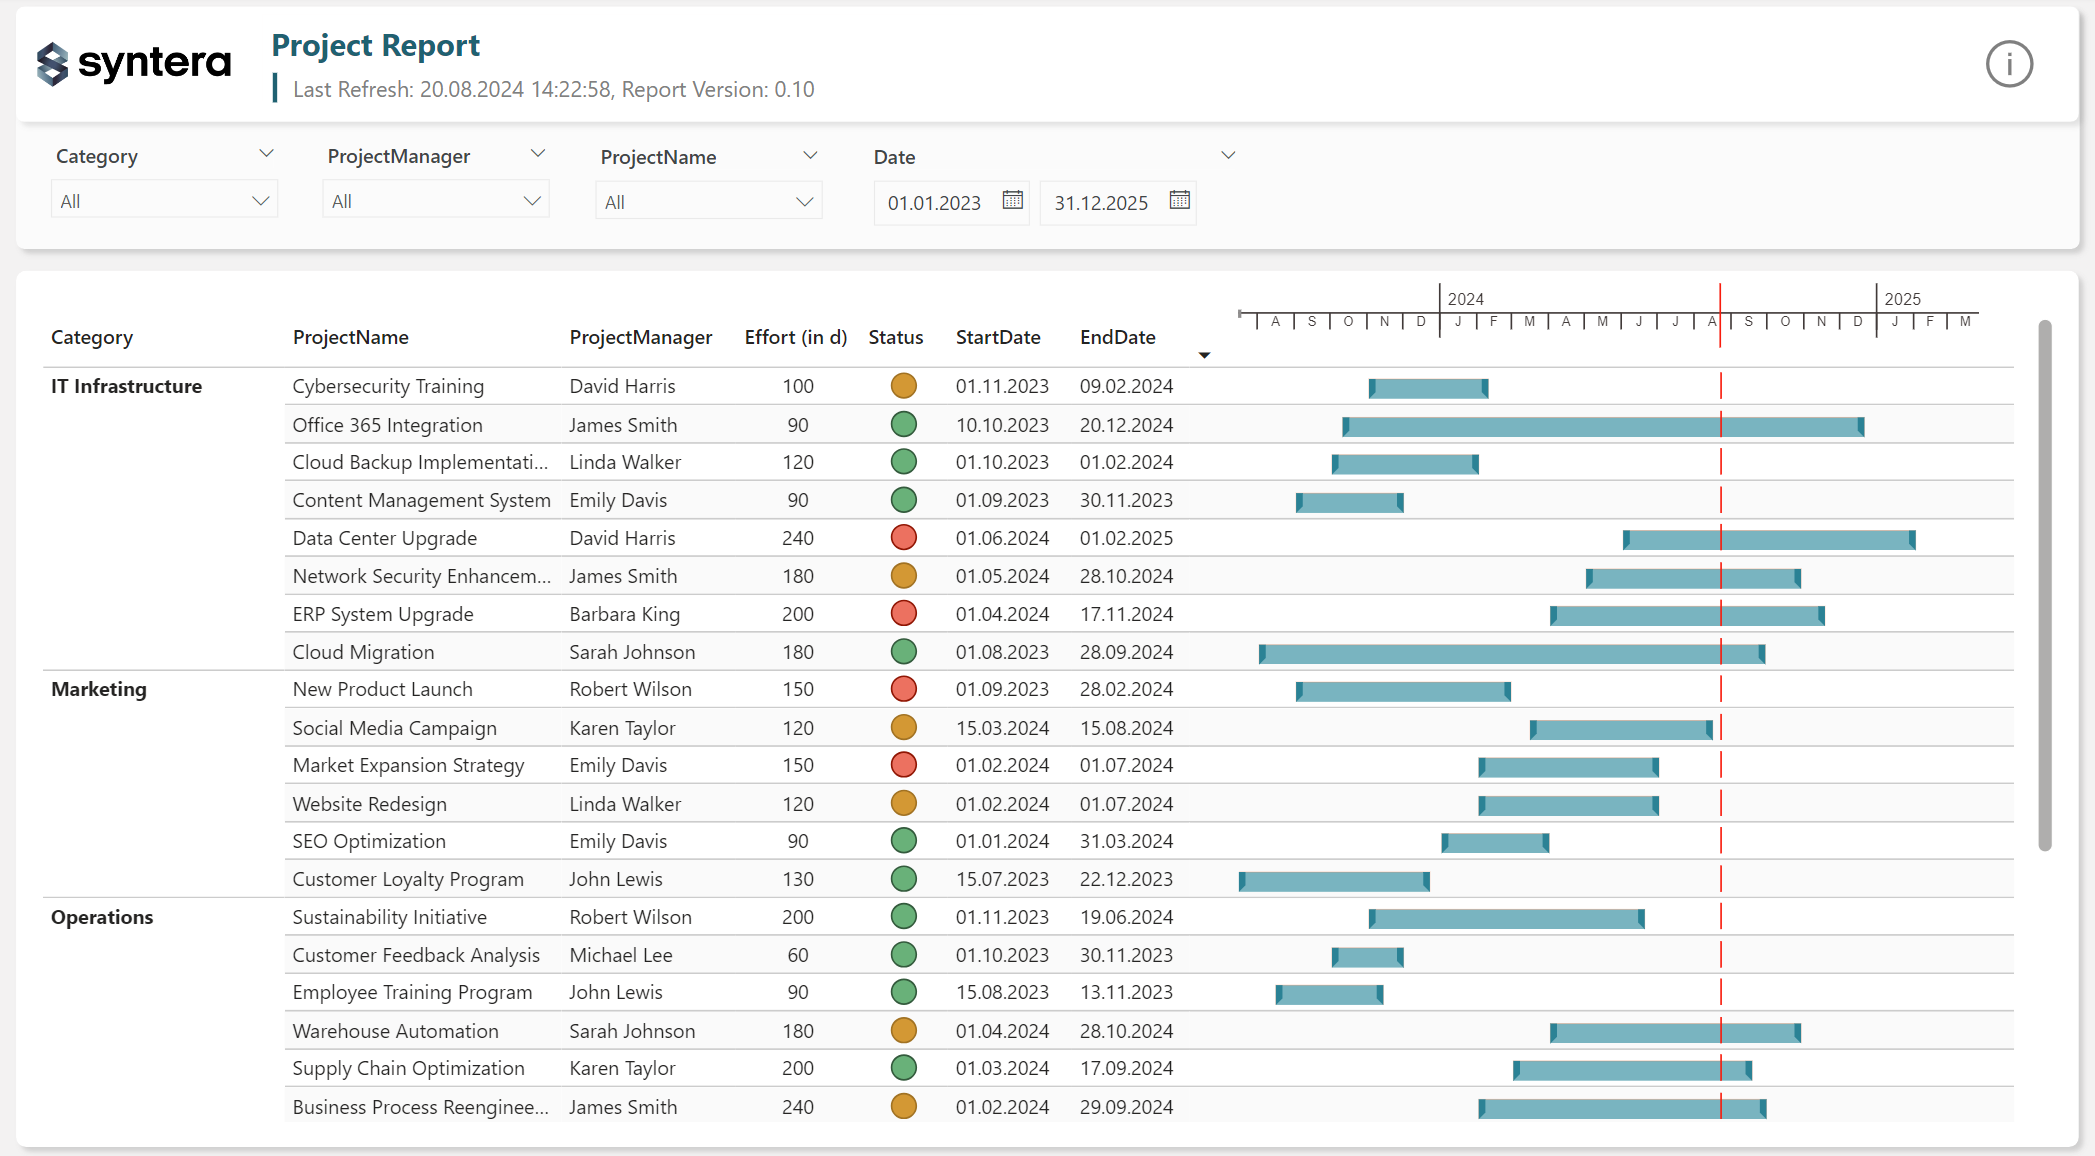
In a recent project, a customer needed a report that provided an overview of the major projects within the company for the current and upcoming year. A Gantt chart is an ideal tool for displaying such data, offering both high-level and detailed views. Given that Power BI is widely regarded as one of the best,…
-
Dynamic Axis in Power BI

Welcome to my blog on how to create dynamic axes for visuals in Power BI using field parameters. If you’re familiar with creating visuals in Power BI, you may have come across the challenge of displaying data over time in a way that remains visually appealing and informative when the time period under consideration changes.…