-
Power BI – Combine all files from folder

In my last blog post, I wrote about the easiest ways to import data from Excel files hosted on SharePoint into Power BI. Another scenario that I encounter frequently is the use of recurring flat file exports from source systems like ERPs, CRMs, or databases, typically as daily or weekly exports. This approach is often…
-
How to Handle API Pagination in Power BI

Getting data from web sources in Power BI is often straightforward with an HTTP request to a web service. The Power Query M formula language provides the Web.Contents function, which can retrieve results from APIs. However, most APIs impose limits on the number of results returned per request – a mechanism known as pagination. To…
-
Power BI data from Excel on Sharepoint

When teaching others how to work with Power BI, I almost always start with the same example: working with a simple Excel file. Typically, the file is stored on SharePoint, and we import the data into Power BI to explore and work on this basic scenario. This approach isn’t just for demonstration purposes, it also…
-
Asana Power BI Report

We are working on multiple projects with Asana and wanted to have insights over some project and task management KPIs within Power BI. There is a dedicated connector within Power BI to integrate data from Asana. However, the licensing requirements to use the connector are the enterprise or enterprise+ tiers. We had a look around…
-
Google Analytics 4 Data in Microsoft Fabric

Google Analytics 4 data is essential for understanding website performance and user behavior. The native dashboard is great for initial analysis but there are other use cases where it is just not quite enough. What if you want to export the data to combine it with other sources? Or give new users the required permissions…
-
Building native Gantt Charts in Power BI

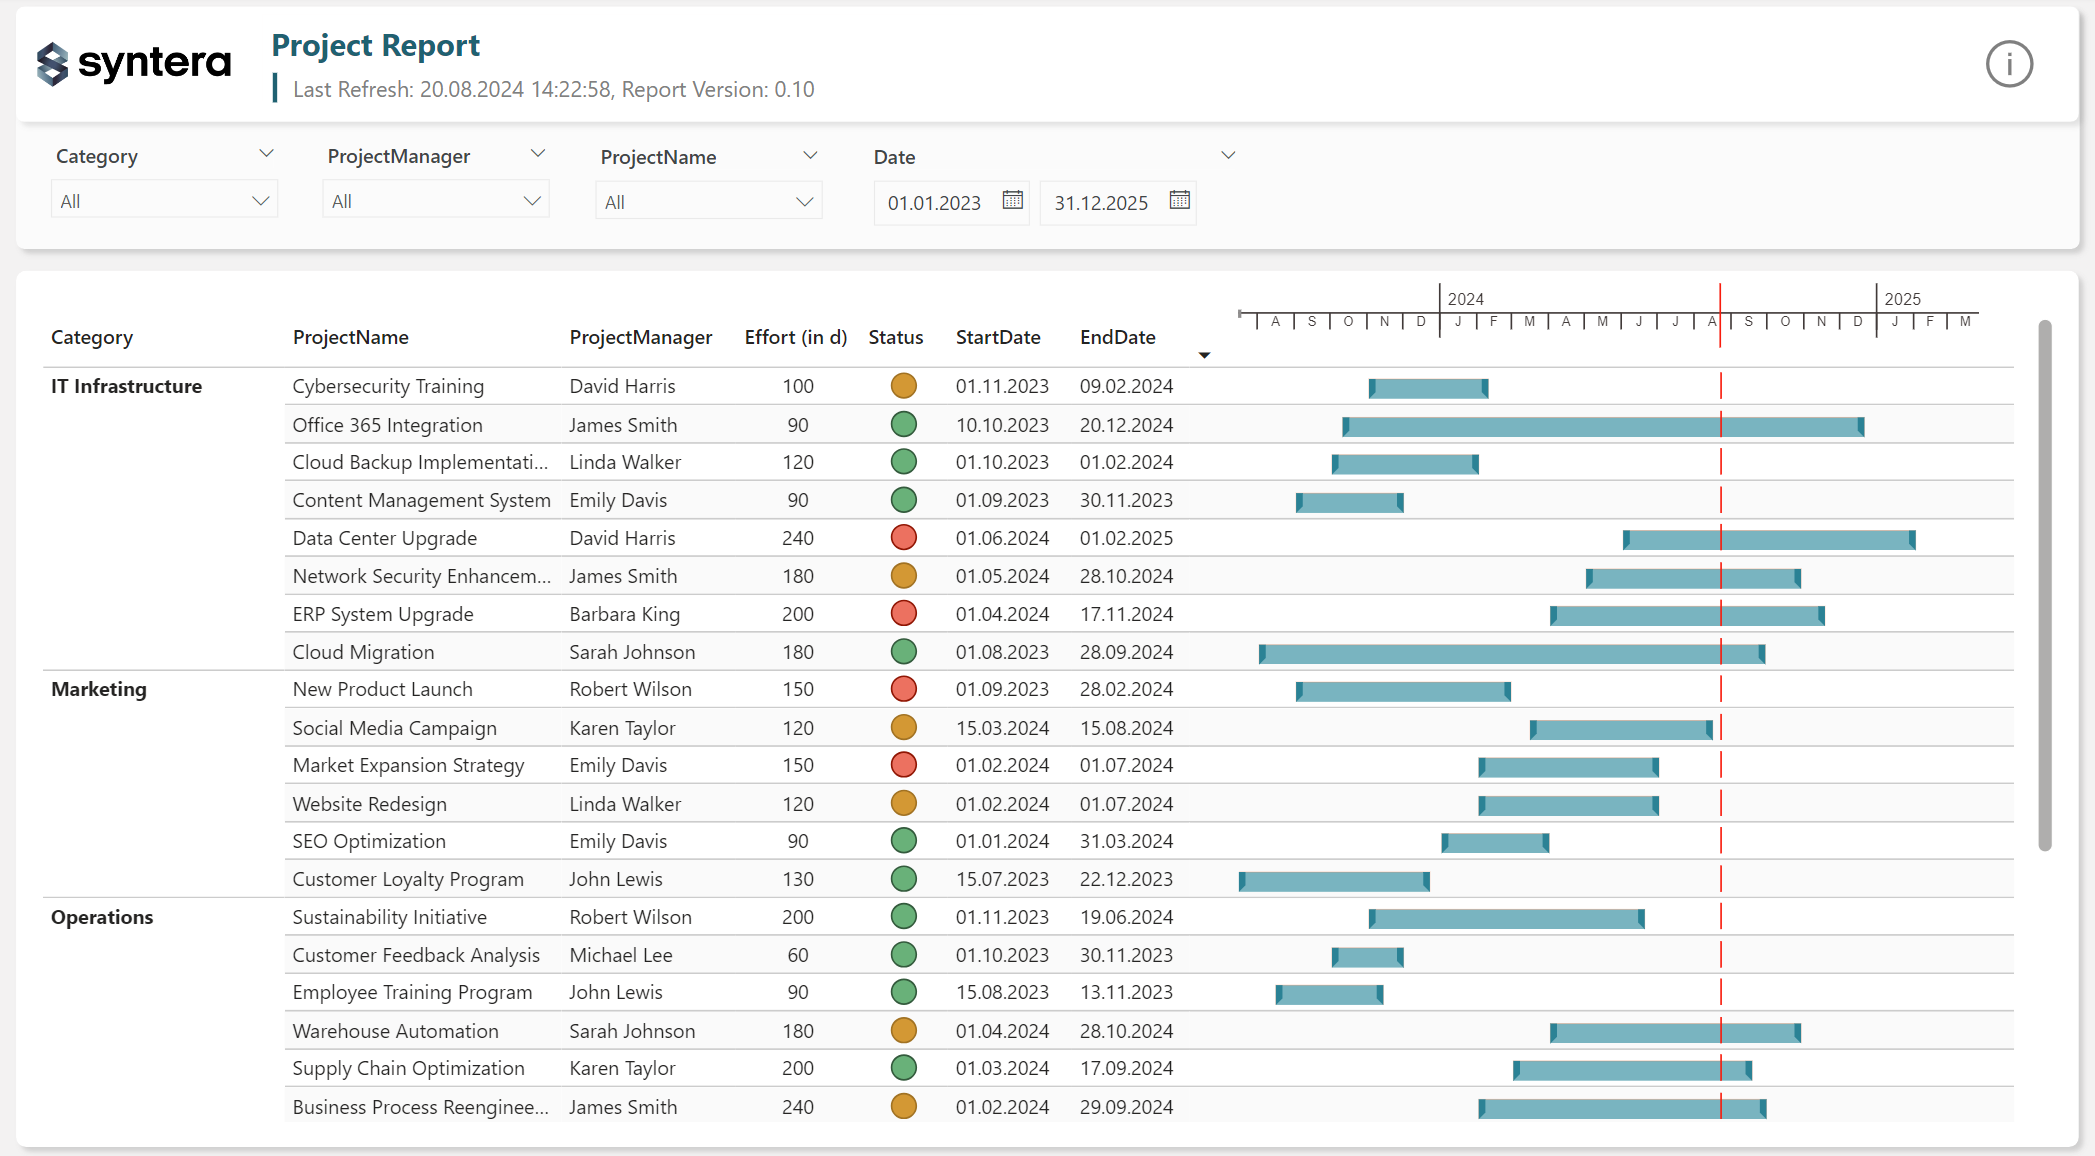
In a recent project, a customer needed a report that provided an overview of the major projects within the company for the current and upcoming year. A Gantt chart is an ideal tool for displaying such data, offering both high-level and detailed views. Given that Power BI is widely regarded as one of the best,…
-
Top N filter on multiple dimensions in Power BI

Power BI makes it fairly easy to implement top N filters on your visuals using the filter pane. You can quickly add the dimension you want to apply the top N filter to, select the number of items to display, and choose the column or measure for the calculation. However, what if you need to…
-
Login to Power BI with Guest Account

As a Power BI developer you are sometimes working for different organizations and have to access multiple tenants. To do this, you either have a dedicated account in each tenant or you are added as a guest to an organization. Accessing Power BI in an external tenant via browser at app.powerbi.com or via Power BI…
-
Single Date Picker in Power BI

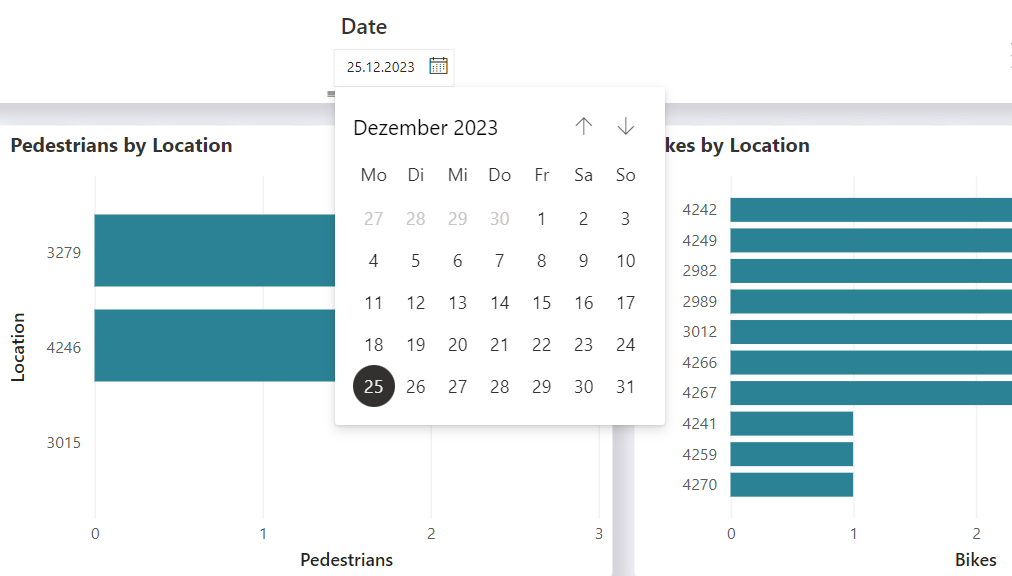
In the sphere of data analysis and visualization, Power BI emerges as a leading tool, adept at turning raw data into comprehensive reports and dashboards. Despite its strengths, we’ve found it lacking a specific, commonly used feature: the integration of a single date picker within a report. This feature, surprisingly not included by default, is…
-
Automated Power BI Testing with Selenium

Working with Power BI can become challenging as the size and complexity of your workspaces increase. Initially, managing a few reports linked to your dataset is straightforward. However, as the number of reports and their dependencies grow, keeping track of everything becomes more difficult. Power BI offers the option to see, what artefacts in your…